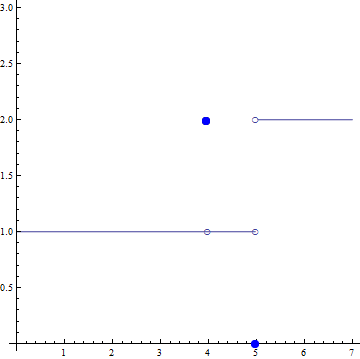
The graph below shows the famous Lagrange's least action principle. You can see this Wiki "Lagrangian mechanics" too
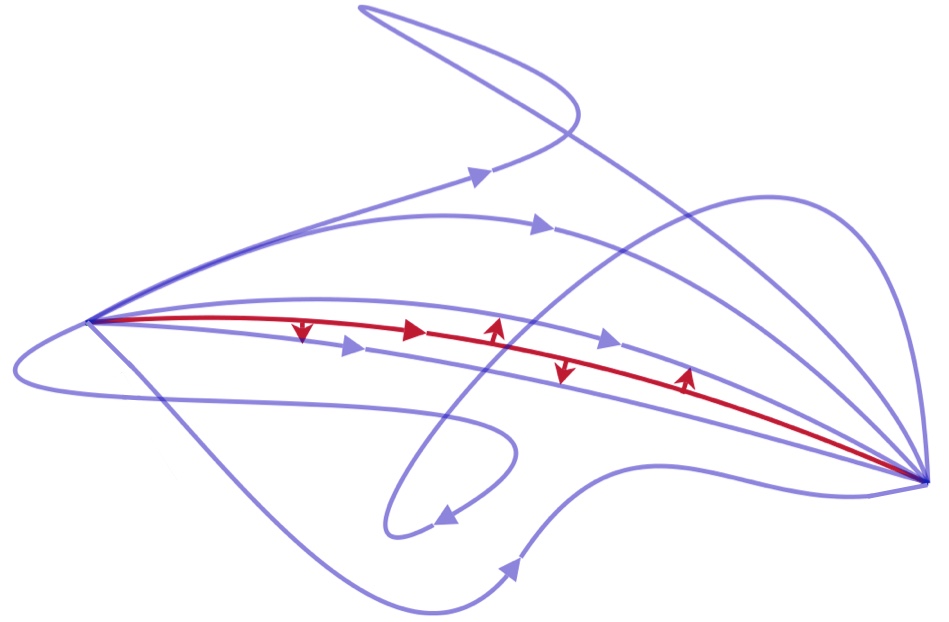
The Lagrangian gives every point on this picture a value and the total
along an entire path is the “action”. The principle of least action
says that the path a system will actually take has the least action.
With this principle, a single Lagrangian can be used to derive many
physical laws at once,
so it’s a good candidate for equations that
aren’t needlessly complex.
https://www.askamathematician.com/2018/05/q-what-is-the-most-complicated-equation/
More aesthetically beautiful graphs are fund in "Lagrange Multipliers" related graphs. These graphs can be found easily on the internet "images".

http://people.duke.edu/~ccc14/sta-663-2016/13_Optimization.html
https://people.duke.edu/~ccc14/sta-663/BlackBoxOptimization.html
https://people.duke.edu/~ccc14/sta-663/BlackBoxOptimization.html
I never studied "Lagrange Multipliers" and highly likely will no study much either though I want to know why "multipliers" is used. "Lagrange Multipliers", very simply put it, seems
"
Section 3-5 : Lagrange Multipliers
In the previous section we optimized (i.e. found the
absolute extrema) a function on a region that contained its boundary.
Finding potential optimal points in the interior of the region isn’t too
bad in general, all that we needed to do was find the critical points
and plug them into the function. However, as we saw in the examples
finding potential optimal points on the boundary was often a fairly long
and messy process.
In this section we are going to take a look at another way of
optimizing a function subject to given constraint(s). The constraint(s)
may be the equation(s) that describe the boundary of a region although
in this section we won’t concentrate on those types of problems since
this method just requires a general constraint and doesn’t really care
where the constraint came from.
"
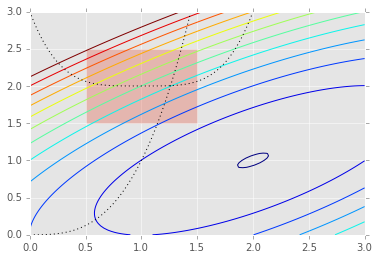
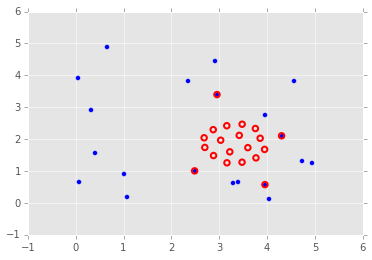
And the graphs made according to this (shown above) are quite beautiful.
The underlined parts which I made can be paraphrased as
Ways of optimizing a function subject to given constraint(s).
This can be applied to our daily life or our hole life as well as paintings. Analogously
How to optimize your paining under certain restrictions given which you cannot control.
In another words, at least a Chinese style painting
Optimize the composition and optimize the use of Contrasts.
We can find many Contrasts in the above three graphs.
Curves - Straight lines (1st and 2nd)
Circles (deformed) - Rectangular (2nd)
Dense and Rare (2nd ad 3rd)
One big difference is
Painting is to represent 3D objects in 2D (on paper) so the crossing is generally impossible.

Apples and oranges (Wiki)
This is a photo not painting but if you make a sketch your sketch will be like this. An apple and a orange cannot crossed physically, one is front and the other is behind. One the other hand the crossing points of the above math graphs mean that two different functions have the same values at these crossing points and some meanings.
<Front and Behind>is a contrast and exhibits an effect indicating 3D. This picture also shows the following contrasts:
Small and Big
Green and Orange in color
Light ad Shade (this exhibits 3D effect too).
In paintings besides the above <Front and Behind >and <Light ad Shade >there is a systematic way to make 3D effect on 2D paper, "perspective" which was developed in Europe.
There are some ways to show 3D on paper in mathematics.
1) x-y-z axis
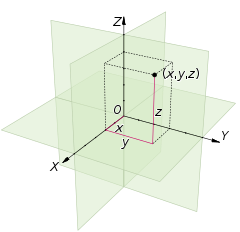
Wiki: Cartesian coordinate system
Not very common and not so visually effective as 1) x-y-z axis there is another way called "Contour Lines". You ca see these lines in a 2D map, especially a map of mountains. The mountain shape is never simple so is its contour lines. Contour lines show some beauty so do mountains.

Constrained Min/Max
http://web.mit.edu/wwmath/vectorc/minmax/constrained.html
The 2nd graph of "Lagrange Multipliers" exhibits beauty of contour lines.
Another commonly seen contour lines are those of whether forecast atmospheric pressure.

http://rubenmontanemapcatalog.blogspot.com/2012/03/isobar.html
http://stormeyes.org/pietrycha/vortex/floyd/floydtornadoes.html
Meteorology
a line on a map connecting points having the same atmospheric pressure at a given time or on average over a given period.
Rare and dense lines show difference of atmospheric pressures at different locations (or more broadly at every location) and indicate the strength (magnitude) of wind and the direction in some extent. The strength and direction of wind remind me of some ways of showing movement and direction of paintings. In maps arrows showing the directions are commonly used to show the direction. But in painting the use of arrows destroy a beauty of paintings. Movement and direction should be express in some other ways than explicit arrows. The use of the contrast of rare and dense lines is one way as shown in the above weather map. The broad line with small triangles has some meaning in the weather map but it also gives a certain effect when you see this as a painting.
Contrasts of
One distinctive broad line - many rare and dense fine lines
Nearly straight lines - curve and circle lines
AAG


